At the end of the month, an ad report lands in your inbox. It has dozens of rows, colorful charts and headings like "impressions," "CTR," "CPC" and "conversion rate." The report opens with good news: clicks are up, impressions grew. Yet your phone is not ringing any more than before, and the money coming into the till has not changed. This is exactly the moment when people start searching for how to read an ad report. You want to know what the report is telling you and, more importantly, what it is leaving out. In this article I explain everything you need to judge a report on your own, with no technical background. I am Ümit Kırkoç. I work alone from Istanbul, and I manage Google and Meta ads as part of my digital advertising service, and I write the reports in plain language a business owner can follow.
Here is the short answer up front. When you read an ad report, you do not start with "how many people clicked." You start with "how many people called, filled in a form or sent a message, and how many of those actually became customers." A click is someone arriving at your door. A customer is someone who walks in and buys. They are not the same thing, and when a report blurs the two, your ad budget quietly drains away.
First, understand what the report is measuring
An advertising platform, meaning Google Ads or Meta (the system behind Instagram and Facebook ads), shows you everything it can measure itself. Most of that describes what happens inside the platform: how many times your ad appeared on a screen, how many people tapped it, and what each tap cost you. That is where the platform's view ends. It does not automatically know what was said on the phone call, whether your quote was accepted, or whether the person later walked into your shop.
So when you read the report, draw two zones in your head. The first zone is the shop window: impressions, clicks, cost per click. The second zone is the outcome of the work: calls, forms, messages, quotes, sales. If a report does not show the second zone, it is only describing the window. A window can look beautiful, but if the shop behind it is empty, the beauty means nothing.
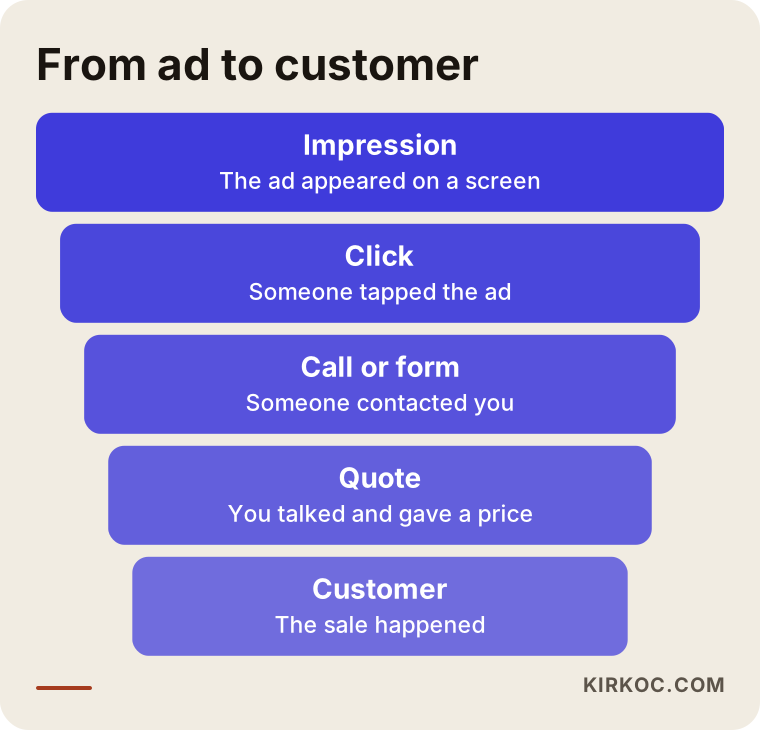
The illustration above breaks the life of an ad into steps. The number of people gets smaller at each step, and that is normal. The problem starts when a report shows only the two widest steps and hides the narrow ones. In your report, look for the bottom step: the real customer.
Do not be intimidated by the language
Most of the abbreviations in a report are fancy names for simple things. In the next section I go through the numbers you will meet most often, one by one. If you do not understand a term, you have every right to ask the person who prepared the report to explain it in their own words. If someone cannot explain a number to you plainly, they probably do not fully understand it themselves, or they would rather not explain it.
What do the numbers in the report mean?
The table below summarizes the figures you will see most often and what each one tells you on its own.
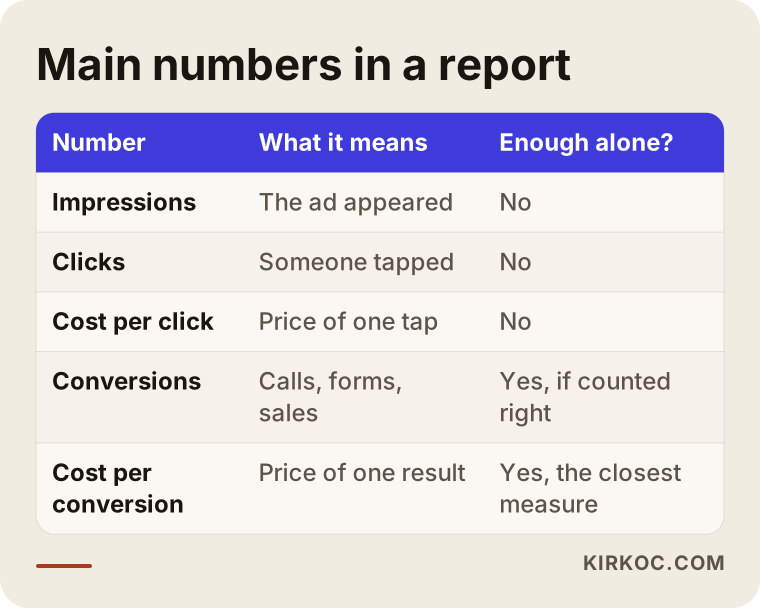
Let me walk through the table in sentences as well.
Impressions are the number of times your ad appeared on someone's screen. The person does not have to have actually seen it. The ad may have sat lower on a page, or been scrolled past. Being pleased about a high impression count is a bit like being pleased about how many cars drove past a billboard. It can matter if your goal is brand awareness, but for a business that wants the phone to ring, it means little by itself.
Clicks (or taps, on a phone) are the number of times someone touched the ad and landed on your website or a messaging screen. A person can tap by accident, wander off out of curiosity, or work for a competitor. A click is the first sign of interest. It is not a result.
Cost per click, often shortened to CPC, is the total you paid divided by the number of clicks. A low figure is not necessarily good news, because the audience that clicks cheaply is often the audience with no intention to buy. An expensive click can be very valuable if it brings exactly the right person.
Conversions are the moment something valuable to you happens: a phone call, a form submission, a WhatsApp message, an add-to-cart, a purchase. This is the most important line in the report, and what counts as a conversion should be agreed with you before anything starts.
Cost per conversion is the money you spent divided by the number of conversions. In other words, it shows what one phone call or one form cost you. It is far more meaningful than cost per click, because it sits much closer to your actual business.
Conversion rate is the share of people who clicked and then completed the action. If this rate is low, the problem is often not the ad. It is the page the person landed on.
Why can the click count be misleading?
Picture two ads. One promises "cheap and fast" and collects a lot of clicks. The other states your service and your city clearly and collects fewer clicks. At first glance, the report makes the first ad look better. But the second ad may be the one making your phone ring. If you decide by clicks, you will switch off the right ad and scale up the wrong one. This is the biggest mistake in report reading.
Write your own goal at the top of the report
Before you look at a report, ask yourself what you expect from these ads. If the answer is "more people should know my business," then impressions and reach matter too. If the answer is "I want my phone to ring and appointments to come in," your focus is the number of calls and forms. If the answer is "I want sales in my online store," then the number of sales and the cost per sale come to the front.
Writing the goal down first sets the direction of the report. Without a goal, a report turns into a showcase for whatever numbers look best to the person who prepared it. I do not say that out of suspicion. When the goal is not clear, everyone shows the shiniest number they have. That is all.
One more note: goals differ between service businesses and product sellers. For a dental clinic, the valuable thing is an appointment request. For an online store, it is a basket and a sale. Whatever the "moment of earning" is in your business, have it placed in the report as something that is measured.
Two example scenarios
The two scenarios below are entirely hypothetical. They do not describe a real company. They are built only to show the logic.
Scenario 1: Lots of clicks, no phone calls
Suppose you own a home renovation company in a big city. In your monthly report, clicks are up from last month, cost per click is down, and the report says "a successful month." But the number of quote requests arriving by phone has dropped. When you open the report and look at the searches, you see that your ad was shown to a very wide audience under a broad promise like "free estimate." Some of the people who clicked may not even be homeowners. They may just be curious about prices.
The answer here is not to raise the budget. You look at which search phrases the people who actually phoned came from. Most likely, curiosity searches like "how much does a home renovation cost" bring many clicks, while clear-intent searches like "bathroom remodel near me" bring fewer clicks but more calls. The budget moves toward the second kind of search, and the irrelevant searches are excluded. A few weeks later, the click count may fall. That period, when the report looks "worse," can in fact be the period when the work gets fixed. If the number of phone calls is rising, you are on the right track.
Scenario 2: There seem to be results, but of what kind?
This time you are a hypothetical online store owner. The report says "one hundred conversions," and that excites you. Looking into the detail, you find that "page views" and "add to cart" were counted as conversions, and that real sales are a very small part of that number. In other words, the word "conversion" in the report does not mean what you meant by it.
This is very common. During setup, every small action gets marked as a "conversion," and the total swells. The fix is to separate the main conversion (the purchase) from the secondary actions and to show the two groups separately in the report. That way "how many people added to cart this month" and "how many people bought" never get mixed up. If the gap between them is big, you look for the problem in the cart or checkout step rather than in the ad.
Reading a report step by step
When you open a report, you can follow these four steps in order. You do not need any analytics knowledge. You only need to know the order.
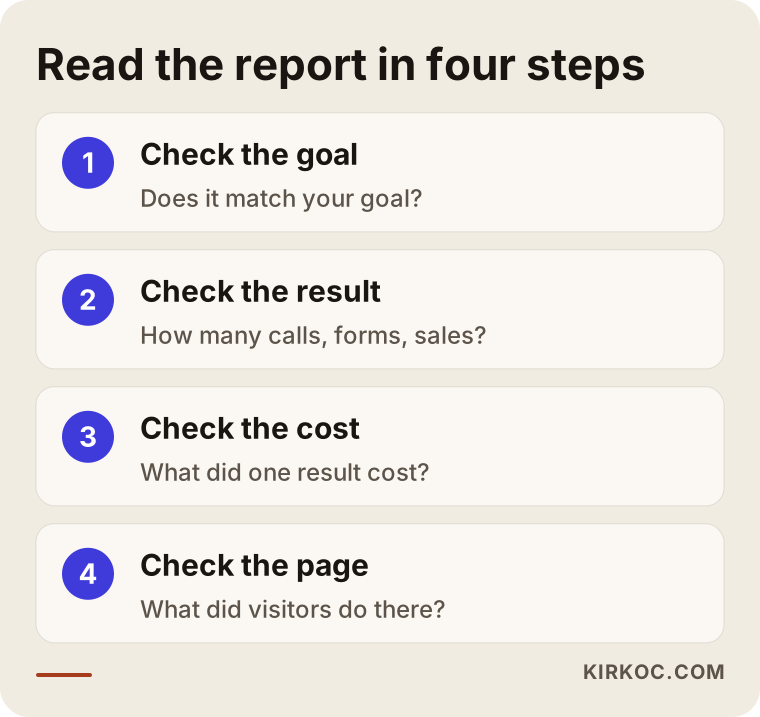
The order in the illustration is the one I follow myself when I review reports. Let me explain each step a little.
1. Check the goal. Was this month's report prepared around the goal you agreed on at the start? If the goal is phone calls and the first page of the report opens with impressions, stop and ask.
2. Check the result. How many calls, forms, messages or sales came in? Compare them with last month. A single month says little; you need to look at a trend of at least three months. Seasonality, holidays and campaign periods all shake the numbers.
3. Check the cost. What did one result cost you? Dividing the total spend by the number of results is the heart of the matter. Put that figure next to what a customer is worth to you. If what you spend on ads stays below what you earn from that customer, the work is sustainable.
4. Check the page. What do the people who click do on the page they reach? If most leave within a few seconds, the ad may have brought the right person and the page failed to keep them. The problem is not the ad. It is the place they arrived at.
Ask where the result came from
When you look at results, ask one more question: which ad, which search phrase, which day and time did these calls and forms come from? In a good report, results are split by source. Saying "thirty calls in total" is not enough. It should say "most of these came from these two ads, from this area." Once you know the source, you can move your budget toward whatever is working.
How do you find the real number of customers?
There is a gap between the conversions the platform sees and the customers you see. Someone who phoned may have received a quote and declined. Someone who filled in a form may have typed false details. The most reliable way to close that gap is to keep a simple record on your own side.
I suggest a very plain method: ask every new inquiry "how did you hear about me?" and write the answer in a table. Mark phone, form and message inquiries separately. At the end of the month you can answer the question "how many inquiries came in, how many received a quote, how many became customers." This table is the most honest way to compare the numbers in the ad report with reality.
In more advanced setups, phone calls and forms are tracked automatically, and the system records which ad a caller came from. That setup is the technical side of the job, and it needs to be done correctly. Badly configured tracking can count the same person twice, or not count them at all. So before you trust a report, it makes sense to ask how the measurement was set up.
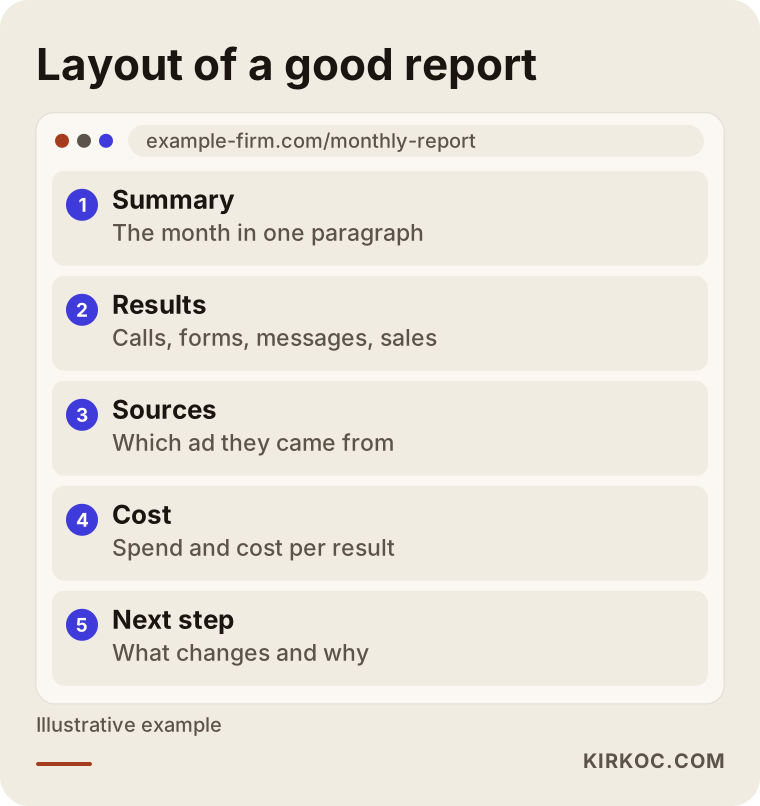
A layout like the one above makes a report easier to read. A one-paragraph summary comes first, then the results, then sources and cost, and finally a section on what will be done next month. A report that only describes the past is incomplete. It should also tell you the next step.
Common mistakes
Most of the mistakes I see with reports fall under a few headings.
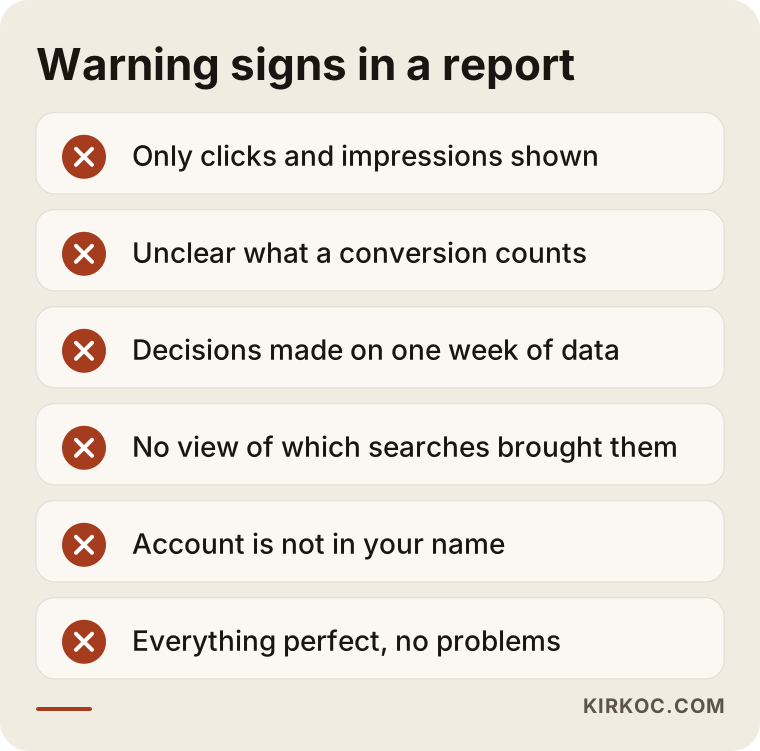
Here is how I would explain the signs in the illustration.
Looking at only one number. Only clicks, only cost or only impressions is a piece of the picture. Numbers should be read together: spend, results, cost per result.
Not knowing what a conversion is. Before you feel good about the word "conversion" in a report, find out what was counted. Pressing a call button and having a phone conversation are not the same.
Deciding on too short a period. Switching off an ad or doubling a budget after looking at one week of data is usually wrong. Platforms go through a learning period, and the numbers swing in the first days.
Not comparing numbers to your own business. Applying another industry's average cost to your business is meaningless. The right cost for you is set by what you earn.
Not checking the searches. Spending budget without looking at which search phrases your ad appeared for means paying for searches you never wanted. In good management, irrelevant searches are regularly excluded.
Receiving reports from an account you do not own. The ad account should be opened in your name, and you should hold the admin rights. If someone else holds the account, your historical data can leave when they do. Settle this at the contract stage.
A report that looks good but does not help
Some reports look very professional: colorful charts, long pages, plenty of numbers. But after reading them, you still cannot answer "so what should I do?" A good report is short, names the next decision, and explains the reason behind the numbers when you ask. A crowded report usually comes either from the preparer's worry about showing their work, or from a weak real result.
Lots of clicks but no customers: what now?
This is the situation business owners run into most often. The decision chart below helps you find where the problem is.
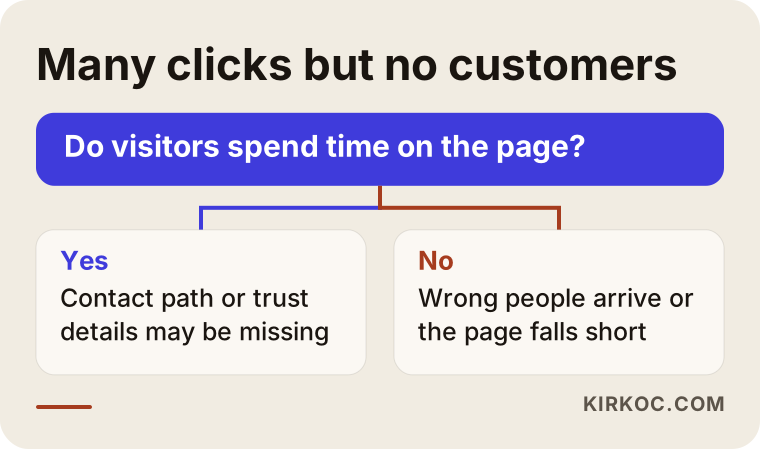
The logic of the chart is this. First look at what the people who clicked do on your site. If most leave right away, either the wrong people are arriving or the page does not convince them. If they stay on the page but do not call or fill in a form, the contact path is hard to find or the information that builds trust is missing.
A few concrete checks:
- Do the ad and the page it leads to say the same thing? If the ad says "open on weekends" but the page does not mention it, people get suspicious.
- Are your phone number and call button easy to see on a phone screen? Most people who tap an ad are on a phone.
- Does the page open quickly? Someone who waits three or four seconds will often go back.
- Is the form short? Every extra field can put off one more person.
- Are there trust signals? Real reviews, a business address and opening hours, for example.
At this point the ad side and the website side of the job overlap. If I manage the ads and someone else built the site, working out which side holds the problem means two people waiting on each other. When both are in the same hands, I can fix a weakness I spot in the ad on the page straight away. That is, to my mind, the most practical benefit of one person handling the whole chain: the problem is found and fixed in the same place, and nobody says "that is not my part."
How do you read each platform?
Google and Meta ads are not read with the same logic.
On Google, people are searching for something. The phrase they type tells you their intent: someone searching "emergency locksmith" needs help right now. So in the report, the search phrases and the results from those phrases are very important. Check whether the words people searched match the service you offer.
On Instagram and Facebook, people are not searching. They meet you while scrolling their feed. Getting attention is harder, but when the ad is shown to the right audience, it can be a strong first contact. Here the ad's image, text and audience details matter more in the report. When you look at the number of messages, look at their quality too. Some campaigns bring plenty of messages, but they come from people who type only "price" and vanish.
Because of this difference, applying the same report template to both platforms misleads you. Each platform needs its own measures and its own questions. Do not judge one by the yardstick of the other.
What should be inside the report
You can use the comparison below to judge a report yourself.
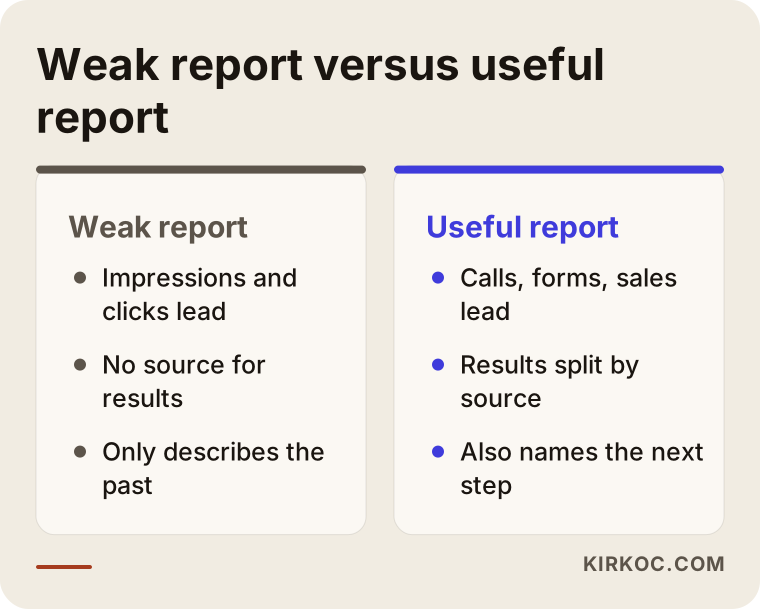
Let me go through the comparison briefly. The report should state clearly which period it covers. It should put total spend and the number of results side by side. It should show which ad, which search or which audience the results came from. It should compare against the previous period. And most important, it should answer "what did I change, why did I change it, and what will I do next period."
Also think about why a report feels reassuring to you. If everything is fine and there are no problems, that itself is a warning sign. A real account always has something to improve. If the report does not say so openly, either the account is not being examined closely enough or you are only being shown the pleasant parts.
How often should you receive a report?
The frequency depends on the budget and the goal, but I can sketch a general path. In the first weeks, frequent contact is good, since you need to read the first signals together while the ads are new. In the following months, a monthly report and a short conversation when needed is enough for most businesses.
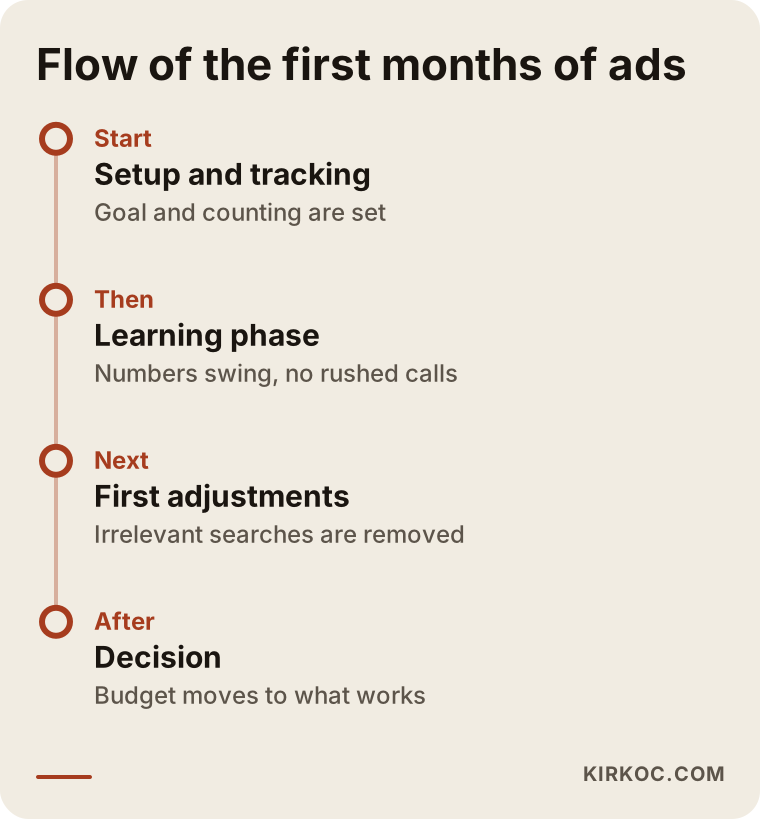
The timeline above shows the typical flow of an advertising program. The first period is setup and measurement, and expecting immediate results is a mistake. Then comes the platform's learning period. After that, the first adjustments are made. Only after this can you answer "are these ads working?" with any confidence. The exact length depends on your industry, the competition and the budget, so I cannot promise a calendar.
What can you do yourself?
If you own your ad account, there are a few things you can do without being an expert.
- Make sure you hold the login rights to the account.
- Write down every inquiry in a table, asking where it came from.
- When you get the report, first ask "how many inquiries came in and how many became customers."
- Search for your own ad on your phone and see what appears. Go to your site like a customer and try making a call.
- Ask about every word in the report you do not understand.
You do need a specialist in these cases: when measurement was never set up or you doubt it, when you have had no results for several months, when you want to raise the budget but do not know where to spend it, when you advertise on more than one platform, or when the report does not convince you. At that point, a view from outside usually finds the difference quickly.
What should you ask an agency or specialist?
When you talk to the person who prepares your report, you can ask the following questions.
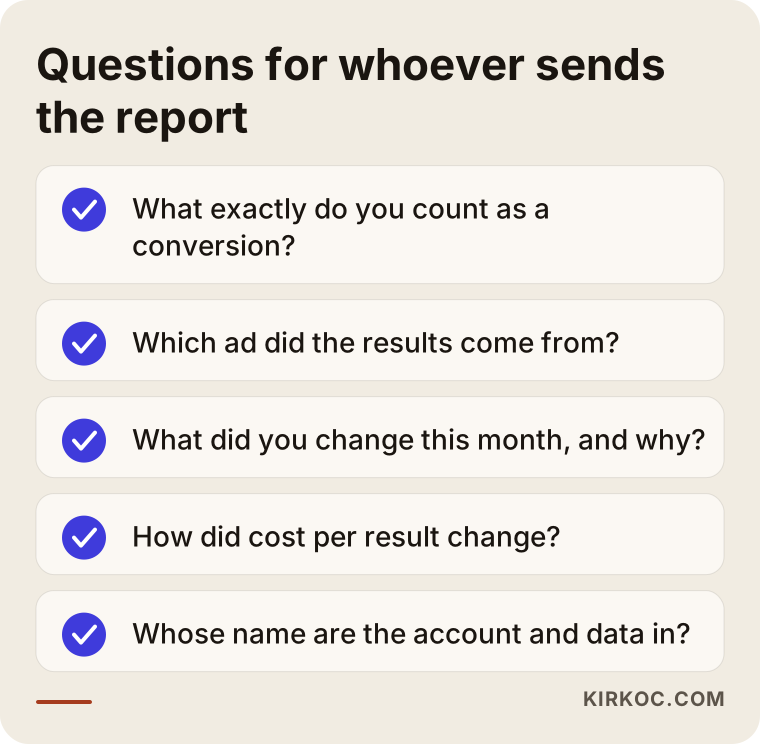
The purpose of these questions is not to corner anyone. It is to build a shared language. In honest work, these questions are answered easily. Someone who dodges them or buries the topic in technical talk is pushing you away rather than guiding you.
When you ask an AI assistant this kind of question, you get a general framework, but it cannot see inside your own account. The example below shows what such a chat might look like, using an entirely made-up text.
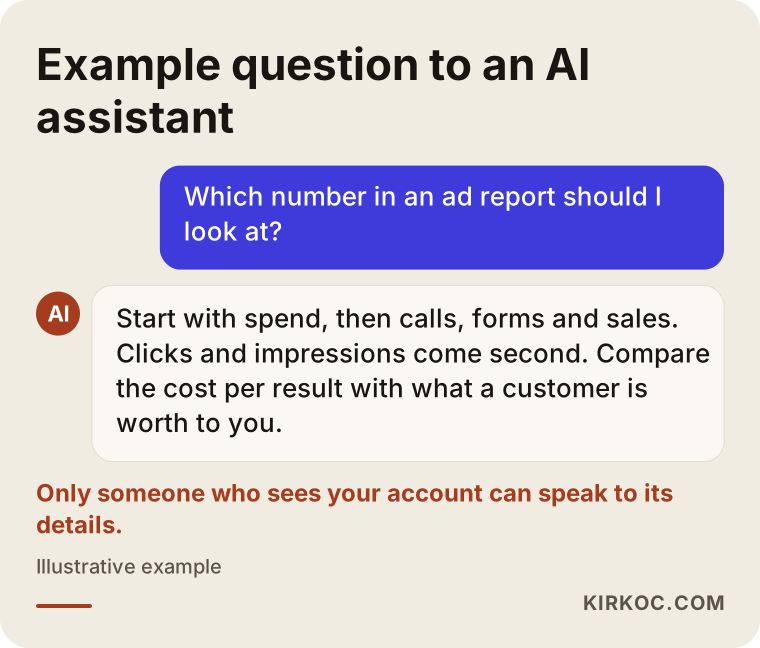
An answer like that is enough to get started. But the details of your own account, such as which search was irrelevant or which page is weak, can only be told to you by someone who can see the account.
What determines the cost of ad reporting?
Reporting is usually not a separate line item. It is part of ad management. Let me list the main factors that affect cost. I am not giving figures here, because every business is different.
- How many platforms you advertise on. Running ads only on Google is a different workload from managing Google, Instagram and Facebook together.
- The state of your measurement setup. Tracking phone calls, forms and sales needs setup. An account that is already configured correctly takes less work.
- The size and complexity of the account. An account with a few campaigns is not the same as a store account with hundreds of products.
- Report frequency and detail. A detailed weekly report takes more time than a monthly summary.
- The state of your page and site. If the page that receives the clicks is weak, it may need fixing alongside the ads.
The budget you set aside for ads and the management fee are separate things. The first goes to the platform, and the second pays for the work. In any quote, ask plainly whether one is included in the other.
How do I work?
First I listen to your business and your goal: what you sell, how customers find you, and where your moment of earning is. Then I set up measurement, because preparing a report without knowing what is being counted is pointless. Once the ads are live, I regularly look at both the account and the page. The report comes as a one-page summary and, if needed, a short conversation. Next to the numbers, it says what I changed, why, and what the next step is.
When your website, your search visibility, your social media accounts and your ads sit with one person, I can solve a problem I spot in a report in the right place. If the ad is weak, I fix the ad. If the page is weak, I fix the page. If the social media profile does not inspire trust, I fix the profile. There is no need to explain it to someone else and wait. That said, this setup is not necessary for every business. If you only need ads, I can work on that alone.
I do not promise any result, ranking or sales. Advertising is a process of trying and learning. My promise is to set up measurement correctly, show the numbers openly, and name the next step clearly every month.
Frequently asked questions
Which number should I look at first in an ad report?
Look first at the total amount spent, then at how many calls, forms, messages or sales that money brought. Clicks and impressions come second. Once you see those first two numbers side by side, you understand at once what the ads are bringing you.
I get lots of clicks but nobody calls. Does that mean the ad is bad?
Not necessarily. The problem could be in the ad, but it could also be that the people it brings are the wrong ones, or that the page they land on falls short. Do not decide before you look at which searches they came from and what they did on the page.
What is a conversion and how is it counted correctly?
A conversion is a valuable action for you: a call, a form, a message or a purchase. To count it correctly, you must decide up front which action counts, and the measurement must be set up properly. A report that shows your main action separately from small actions like add-to-cart is more trustworthy.
How often should I receive a report?
More often in the first weeks, and after that a monthly report is enough for most businesses. Making big decisions from one week of numbers is risky. You need to see a trend over at least a few months.
Whatever the report says, how do I find out my real number of customers?
Ask every inquiry where they heard about you and write it in a simple table. At the end of the month you can see from your own records how many inquiries turned into quotes and how many into customers. That record is the most honest source you can compare with the platform's numbers.
Whose name should the ad account be in?
It should be in your name, and you should keep the admin rights. The person or firm managing it gets access from you. When the work ends, your account and historical data stay with you. Talk about this before the work starts.
How do I read the reports if I run both Google and Instagram ads?
Judge them separately. On Google people are searching for something, and on Instagram they come across you in their feed, so they are not judged by the same yardstick. The shared measure is still cost per result, but you should expect different things from each platform.
I do not understand the report. Should I feel inadequate?
No. A report should be written so that a business owner can follow it. If part of it is unclear, the reason is usually that it was written too technically. Ask for a plain answer.
If you would like to go through your ad report together, check whether your measurement is set up correctly, or plan a new advertising program, you can reach me through my digital advertising page. I will listen to your situation and tell you honestly what can be done.