At the end of the month a file full of colorful charts lands in your inbox. Followers are up, reach is a huge number, likes have climbed. Meanwhile, you look at your register or your calendar and see that very little has changed. It is completely reasonable to wonder how to read a social media report and what these numbers are actually telling you. Many reports are built to show how much work the preparer did, not to help the business owner decide anything. In this article I explain everything you need to open a report and answer one question: is this work bringing me customers? You do not need technical knowledge. The reading order works whether you outsource the work or run your accounts yourself. I am Ümit Kırkoç, based in Istanbul, and I handle the digital side of a business from one desk. When I do social media management, I build every report around one question: how many people tried to reach the business this month?
Let me set one thing straight first. A report is not a report card. It is a map. A good report does not say "people loved our posts." It says "this post brought this many people to your inbox, that post brought nobody, and next month I will change this." Once you adopt that view, even a heavy-looking spreadsheet becomes readable in a few minutes.
Before you open the report: what question are you asking?
Before you look at any chart, write one sentence: "What do I want from social media?" For a cafe, the answer might be "weekend brunch reservations." For a clinic, "appointment requests." For a wholesaler, "new companies asking for a quote." For a boutique, "orders by direct message." A report opened without that sentence tends to swallow you in numbers that look nice.
Social platforms hand you a great many numbers. Most of them are accurate, but most do not touch your business. A like is a reflex in someone's fingertip. For that person to become a customer, they have to take one more step. Reading a report is mostly the art of looking for that one more step.
The picture below puts two groups of numbers side by side, the ones that look pleasant and the ones that pay the bills.
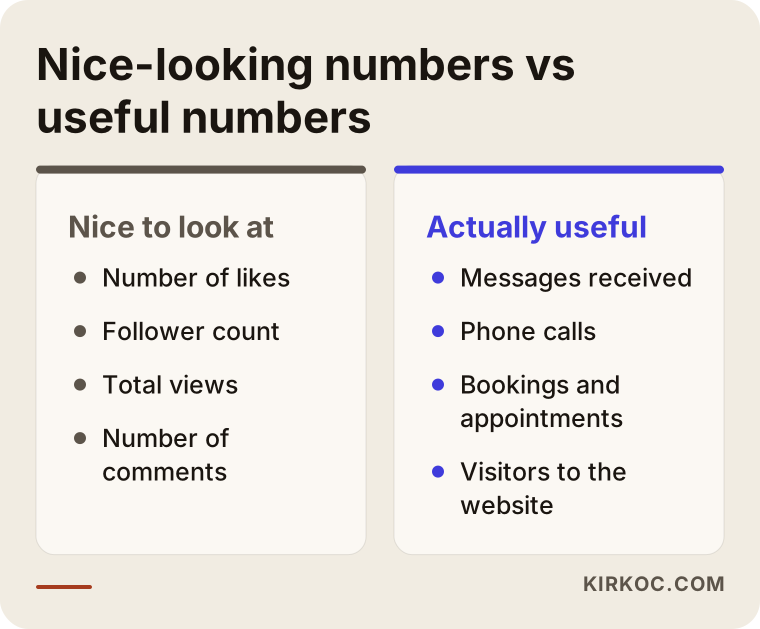
I do not throw the left column away. Those numbers help you judge whether a post caught anyone's attention. The problem begins when they are presented alone as proof of success. The right column holds the stops along the road to your cash register, and if a report never mentions them, the report is incomplete.
There is a path inside the report: from being seen to being bought from
When a customer finds you on social media, they usually travel the same road. First they see a post. If something interests them, they open your profile and look around. Then they send a message, call, or walk in. Some do not buy right away; they come back weeks later. At every step on this road, some people drop away. That is natural, and it is not unique to social media. It is how any sale works.
Your job when reading a report is to see how many people remain at each step. The number at the top will always be the biggest. The real information hides in the move from one step to the next.
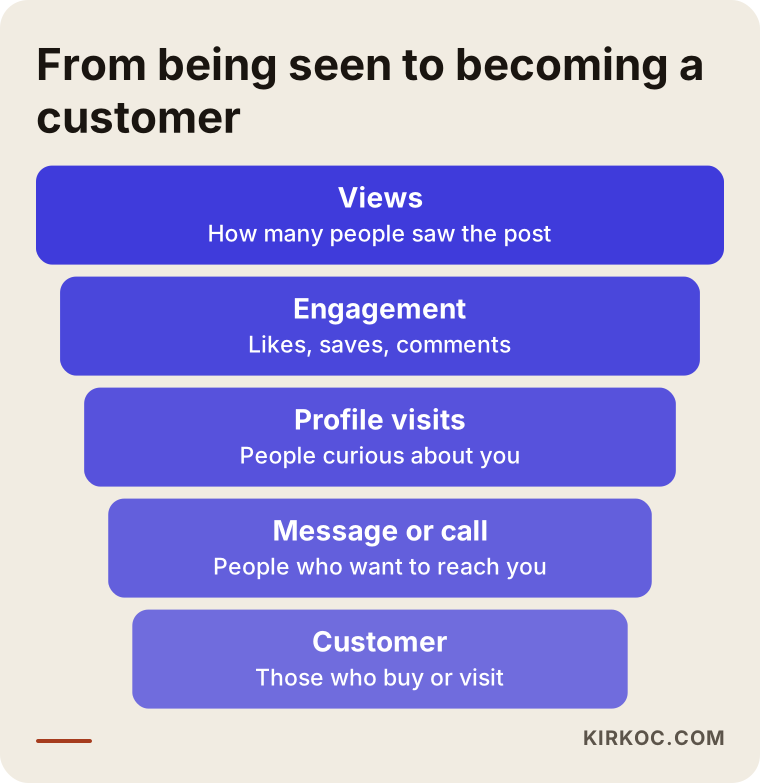
A funnel like this helps you place each number in context. If views are high but profile visits are low, the post grabs attention but does not spark curiosity. If profile visits are healthy but messages are missing, something on your profile is off: the bio may not inspire trust, the contact button may be hidden, or it may not be clear what you sell. Every drop points to a different problem and calls for a different fix.
Reach and views are not the same thing
These are the two words reports mix up most often. Reach tells you how many different people saw your content. Views tell you how many times it was shown in total. If one person sees your post three times, reach goes up by one and views go up by three. When both numbers sit side by side in a report, always ask which is which. If whoever prepared the report cannot explain it in one plain sentence, ask them to do so at the next meeting.
Which number means what, and when does it mislead?
The list below covers the main numbers you will meet in almost any report, what they tell you, and where they can fool you. Treat it as a cheat sheet to keep next to you when you open the file.
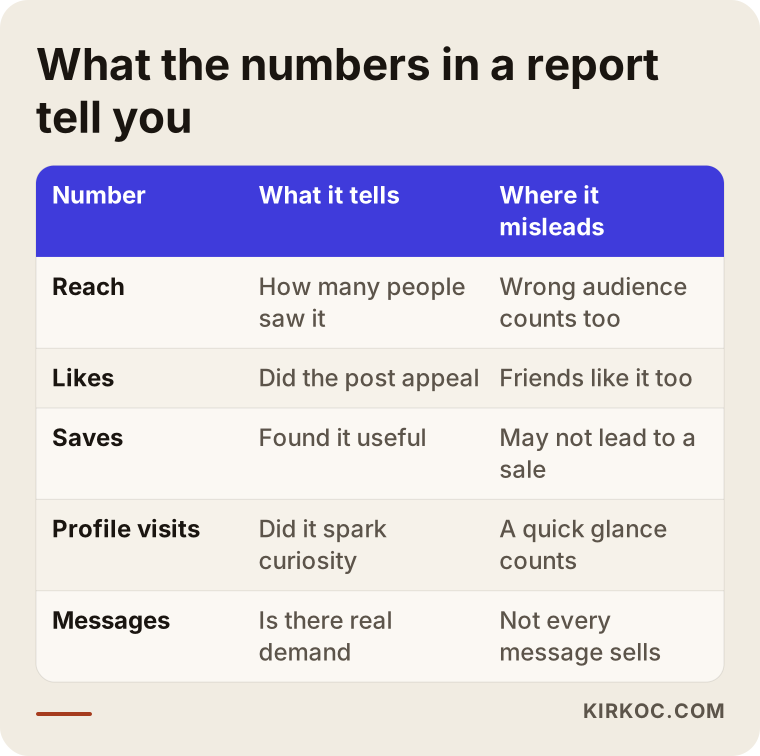
As the table shows, no number is "bad." Follower count is noise if the followers are the wrong people, and a real asset if they are the right ones. Likes may come from friends and never bring business, yet they still measure the tone of your content. What matters is reading each number within its own job description and not expecting more from it than it can give.
Why follower count alone can mislead
A business's followers are not necessarily its customer pool. An audience gathered through giveaways, or made up of accounts from far-away places with no interest in what you sell, inflates the figure and never changes a single month of sales. When you look at follower count, add one more question: how many of these people live in the area I serve, and how many look like my customers? Each platform's built-in analytics shows the city, age range and language of your audience, and a good report includes that breakdown.
Step by step: how to read the report
Going in the same order each month turns report reading into a habit. I suggest these five steps.
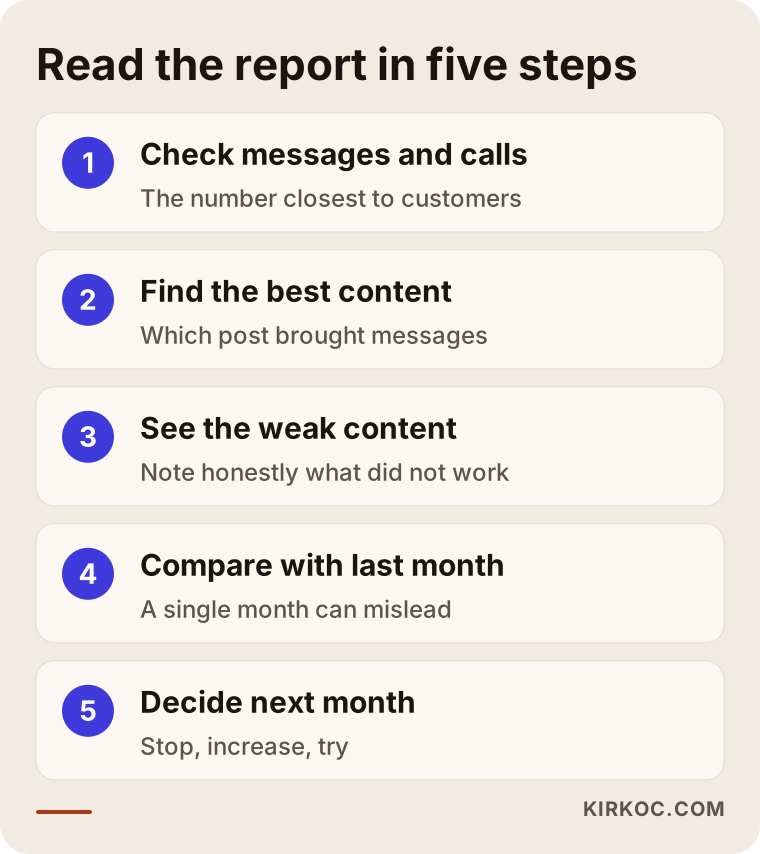
The logic is simple. You start from the number closest to your money and walk backward. That way you reach the heart of the matter before the noise of the charts can pull you away.
1. Start with messages, calls and bookings
The first page of a report should show messages from your profile, phone calls, direction requests or website clicks, and form submissions. Some of this lives in the platform's own dashboard. Some is completed only when you report it. This is where the business owner matters most: you are the one who knows how many messages were real inquiries and how many turned into orders or appointments. If the report does not ask, keep your own notes.
2. Then find the content that brought the most business
Among everything published in a month, one or two pieces usually bring clearly more messages or saves than the rest. What did they talk about? What format were they: a short video, a photo series, a text post? Giving that topic a bit more room next month is often the cheapest improvement available. If the report does not show this, ask for a table that goes down to individual posts.
3. Then look honestly at what did nothing
Content that did not work is not an embarrassment; it is data. If you posted product photos for a whole month and received no messages, the problem may not be photo quality. It may be how the product was presented. This part of the report shapes next month's plan.
4. Compare with earlier months
A single month's number is often meaningless. Season, holidays, even the weather can move things. A cafe seeing fewer messages in a rainy month does not prove the content was bad. For comparison, a series of at least two or three months is healthier, and the same period last year is better still.
5. Finally, decide what happens next month
If a report leads nowhere, it is not doing its job. Every report should end with three lines: "I am stopping this, increasing that, trying this." Without those lines, the report only describes the past.
Two hypothetical example scenarios
The examples below are entirely invented. They do not describe any real company or person. Their purpose is to show how one report can be read through two different lenses.
Example scenario 1: a cafe with lots of likes and few customers
Imagine you run a small cafe in a busy neighborhood. Your month-end report shows more followers, one latte art video watched by a lot of people, and very high like counts. Yet the register looks the same. Read it in the order above. Messages and reservations show no increase. The most-watched video actually shows a technique rather than the cafe itself, and most viewers are in other cities. Profile visits are low because nowhere in the video does the cafe's name, area or opening hours appear.
The decision that follows: the content is good, but it speaks to the wrong audience. Next month you keep the same quality but film the room, the street and the breakfast menu, and every post carries opening hours and a way to reserve. In the next report you stop asking "how many watched?" and ask "how many wrote to the cafe?" I will say this without any promise: that change may not raise your message count. But you will learn clearly what works and what does not.
Example scenario 2: a wholesaler with few followers but steady inquiries
In the second scenario there is a hypothetical wholesaler that sells fabric to retailers. Its LinkedIn and Instagram accounts are small, with a few hundred followers each. Likes look low in the report. But the messages section shows that every month a handful of people write asking for the price list and minimum order quantity. Some of those conversations turned into real orders.
For this business, a small follower count is not a problem, because the audience is made up of the right people. What a good report would say here: do not chase numbers to grow the account; make content that answers the questions the current audience already asks. A post such as "what to check when buying fabric wholesale" may not collect a thousand likes, yet it catches the attention of the right buyers. The lesson is the same in both scenarios: what matters is not how big a number is, but who it came from.
The most common mistakes when reading reports
Some of these mistakes come from the person who prepares the report, some from the reader, and some from the two sides not talking enough.
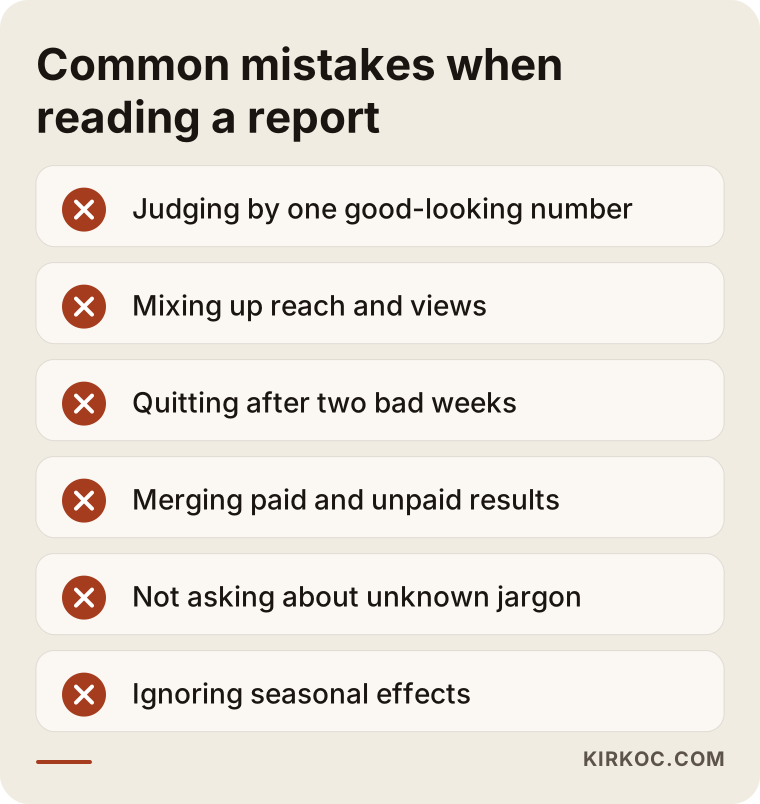
The sneakiest mistake on the list is looking at one pretty number and calling the whole effort a success. The second is the opposite: abandoning the work after two bad weeks. For most businesses social media takes a few months to settle, and reading meaning into a one-week swing is like looking at the sky for one day and declaring the season.
When the report is not written in your language
Another problem is a report written in a language the owner cannot follow. A page packed with "CTR, CPM, impressions, engagement rate" exists to look impressive, not to inform you. Every abbreviation should come with a plain explanation. Do not hesitate to ask about a term you do not understand. A good provider will not mind and will in fact be glad you asked.
When paid and organic results get mixed up
When you spend an ad budget, it is no surprise that reach grows. If the report does not separate paid and unpaid results, you cannot tell which one produced what. Seeing the natural work on your accounts and the results of Meta ads in two separate columns lets you make better decisions and split your budget more sensibly.
Is the report healthy? A short decision tree
You do not need complicated analysis to find out whether your report is useful. One question is enough to start.
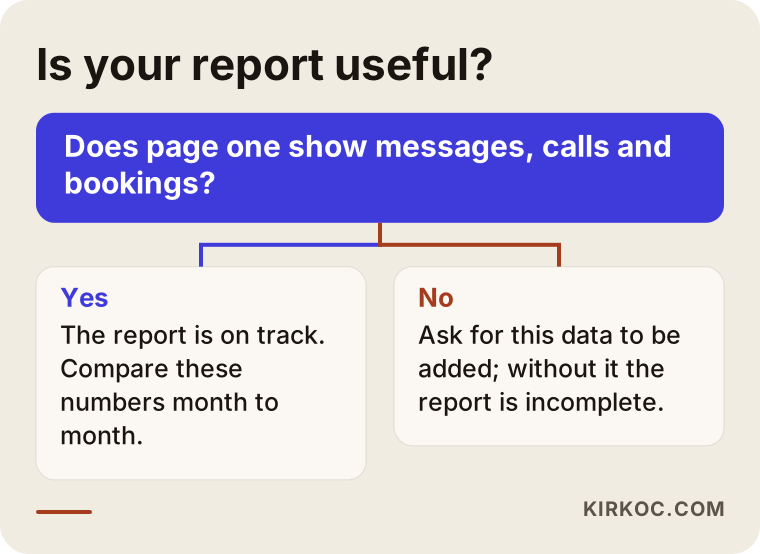
If the first page does not include messages, calls or appointment requests that reached your business, ask for them to be added. Part of this data does not arrive automatically from the platforms. You and your provider need to track it together. For the first two months this shared tracking may feel like a chore, and then it becomes routine.
The monthly rhythm: when and how should you talk about the report?
A report is not a single meeting; it is a cycle. When you follow the same rhythm every month, numbers accumulate and changes become visible.
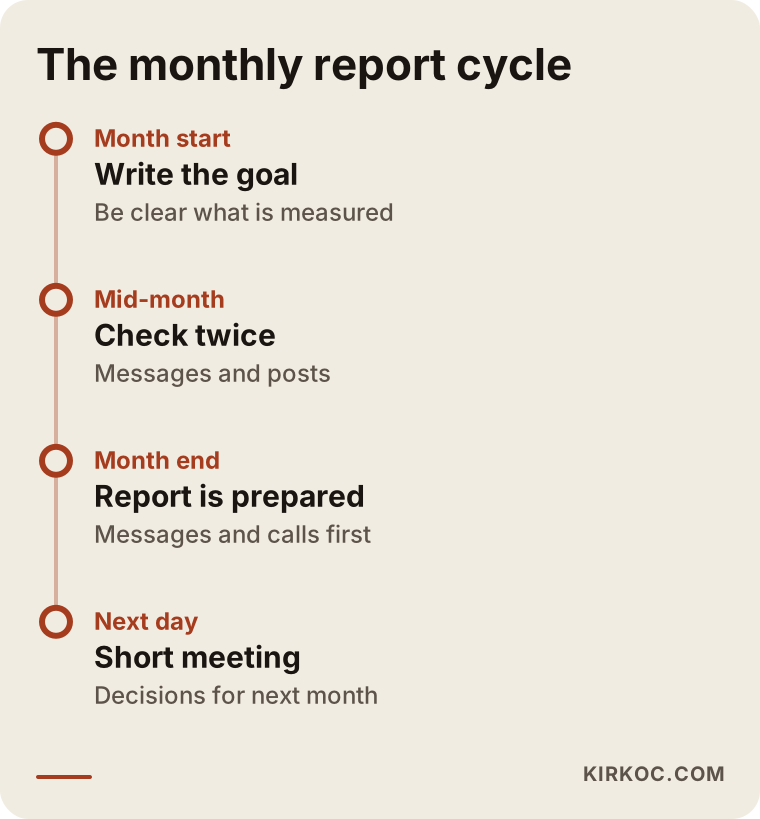
At the start of the month, the goal should be in writing. During the month, messages and published posts should be reviewed at least twice. At month end the report is prepared and discussed in a short call. The purpose of that call is not to read out numbers but to settle decisions: what will change next month? Even a flawless report on paper is wasted if that conversation never happens.
What you can do yourself
Whether or not you hire help, you do not need technical skills to keep an eye on your account's health. The small checklist below takes about fifteen minutes at the end of the month.
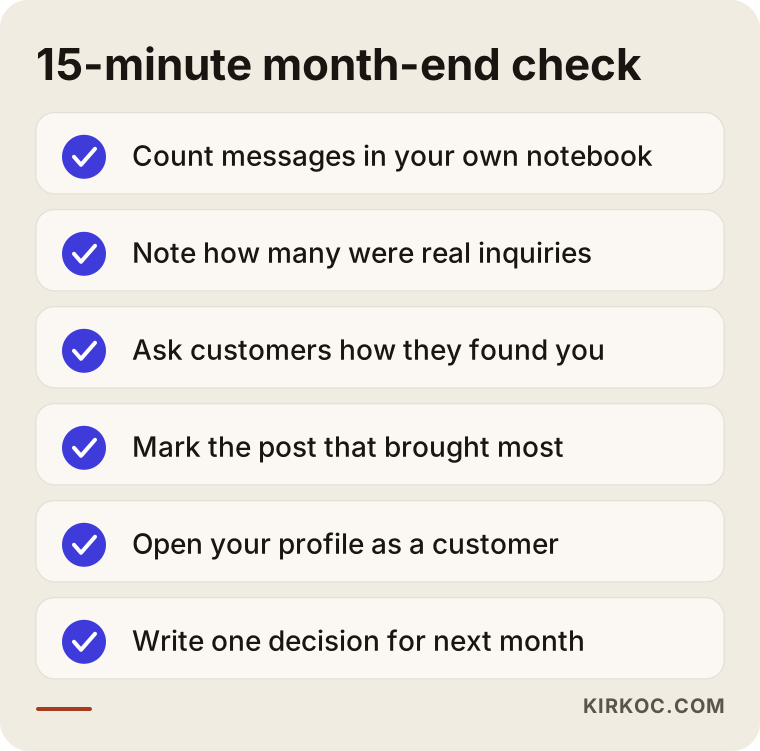
The most valuable item on the list is counting your messages yourself. The number a platform shows and the number of real inquiries in your own notebook can be quite different. You can also answer "how many people came from social media this month?" by asking your customers. Asking "how did you hear about us?" at the register or when booking an appointment gives you something no dashboard can. Build that question into your routine, and within a few weeks you will have a rough idea of how many people arrive through social media.
Look at your own page through a customer's eyes
Reading the report matters, but so does opening your account as if you were a first-time visitor. Is the profile photo sharp? Does the bio say what you sell and where you are? Does the contact button work? Is there a pinned post? If a customer trips over these simple obstacles on the way to reaching you, even the best content will not turn them into a message. I recommend repeating this check every three months.
When do you need a specialist?
There is a lot you can do alone, but at certain points an outside pair of eyes really speeds things up. The first is when you have to run several platforms (Instagram, Facebook, LinkedIn, TikTok, YouTube) at the same time. The second is when you spend on ads and cannot separate which ad brought what. The third is when you cannot connect social media, your website and Google searches. A customer often sees you in one place, researches you in another and contacts you in a third. Seeing that whole path as one piece gives a far more meaningful picture than separate reports held by separate people.
This is where having everything handled by one person pays off. When your site, your search visibility, your social media and your ads are all with the same person, the report does more than say "this happened on that platform." It can say "people who saw you on Instagram and visited the site leave on this page, so let's fix that page." When the work is split across providers, that link usually gets lost, because each provider reports only on their own corner.
What to ask when requesting a report
When you are buying a service or judging the one you already have, I suggest asking these questions. How often will I receive a report? Which tool do the numbers come from, and can I look at the same dashboard? Will messages and call counts appear in the report? Apart from likes, what results will the work be judged on? What happens if a number goes the wrong way? The answers show how seriously the person takes the job. One more thing to note is access: you should always own the account, and you should be able to see the data behind the report whenever you want.
What would an AI assistant tell you?
Today many business owners ask an AI assistant, "how do I interpret my social media report?" The answers are usually a good starting point, but the assistant cannot know your actual situation. The image below shows an invented example of such a question and why the answer has to be backed by your own data.
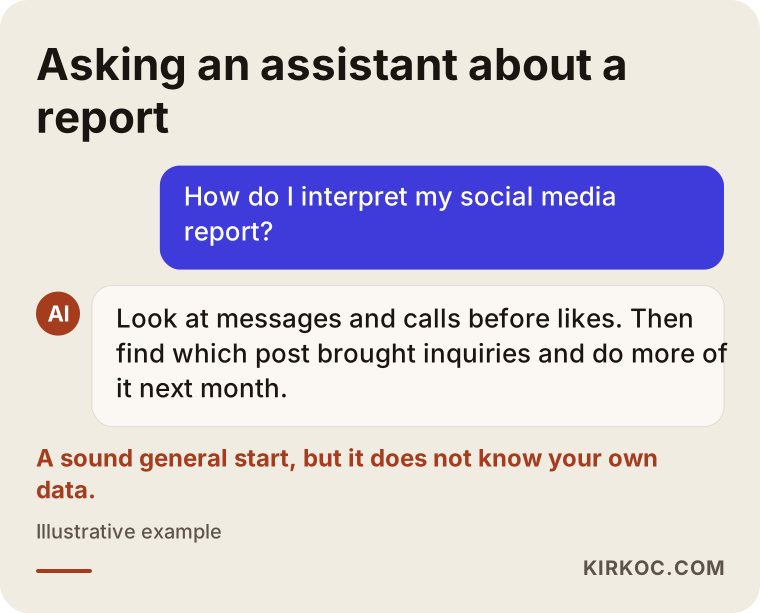
General answers point you in the right direction. But which post brought messages, and which message turned into an order, is something only you and the person running the work can know. Use such tools as helpers and make the decision with your own numbers.
What does a good report page look like?
Whenever a report lands in your hands, look for the skeleton below. The page count does not matter; the order and content do. A short, plain report is often worth more than a long, tangled one.
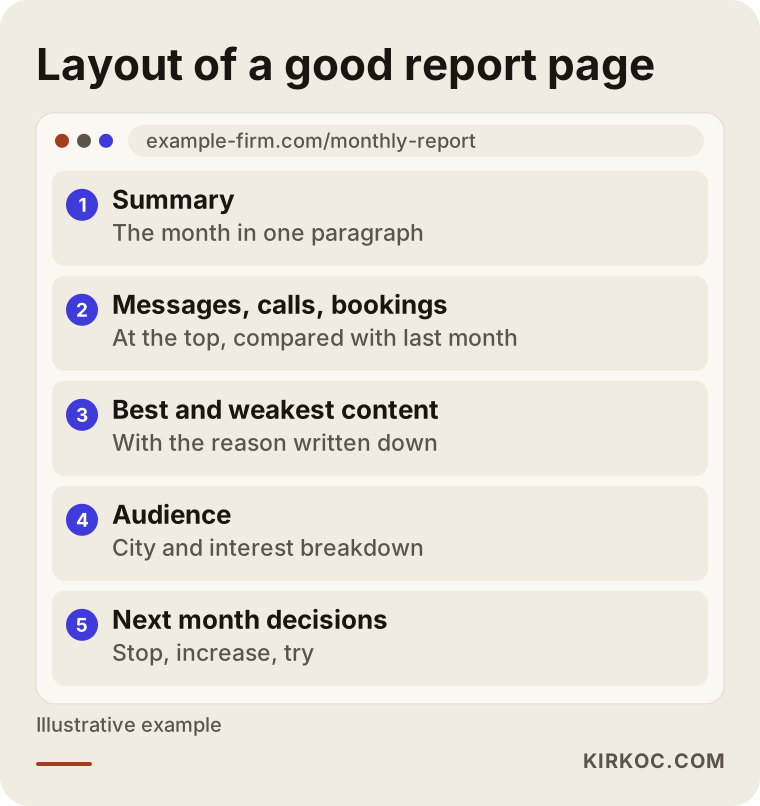
If there is a one-paragraph summary at the top, message and call counts right below it, then the best and worst content, then who the audience is, and decisions for next month at the bottom, the report is useful. Charts exist to support that skeleton. If the skeleton is made of charts alone, the report is decoration.
What drives the cost of social media reporting?
Reporting looks like a separate line item, but it really sits inside social media management. I do not quote numbers here, because the cost depends on the scope of the work. The main factors are how many platforms are covered, how many pieces of content are produced each month, whether photo and video shoots are needed, whether ad management is included, who answers messages and comments, and how detailed the report will be. For the reporting part specifically, what matters is how many sources the data is pulled from and how often you meet.
When you receive a quote, ask exactly what the report contains. Two offers at the same price can differ: one may include only a follower chart, the other may track messages and bookings. When comparing the two, look at the content, not the price.
How I work with you
I work alone, so the person you talk to is the person doing the work. In the first conversation I listen to how your business runs, how customers find you, and what you expect from social media. Then I review your current accounts and any old reports, and we write down together what will be measured. Content is planned and published on a monthly rhythm, and at month end I give you a plain report: messages and calls first, then what worked and what will change. Because your website, your search visibility and your ads are with me too, I can often explain why a number dropped by looking in one place. I do not promise results, but every month I show you plainly what worked and what did not.
Frequently Asked Questions
What is the most important number in a social media report?
It depends on the business, but the general rule is this: the number of people who reached you, meaning messages, calls, appointments and direction requests. Followers and likes are supporting information. Your main decision should rest on the first group.
Do likes and followers not matter at all?
They matter, but they are not enough on their own. Likes show whether a post appealed to people, and follower count means something when the right audience is being reached. Read both as the beginning of the road to a customer.
How often should I receive a report?
For most small businesses, once a month is enough. If you run ads, a short check every two weeks also helps. Looking more often tends to make you read meaning into random ups and downs.
If the numbers are bad, should I switch providers right away?
Not right away. First look at the cause: is the content weak, the audience wrong, the profile incomplete, or is it simply the season? If there has been no progress after a month or two despite a clear plan and measurable decisions, that is the time to reassess.
How do I know the numbers in the report are accurate?
You can open the platform's own dashboard and look yourself. Your provider should add you to the account or dashboard the report is based on. If there are unexplained differences between the report and the dashboard, ask why.
If messages do not turn into sales, is the problem social media?
Not always. Slow replies, unclear pricing, or a website that does not inspire trust can also lose the sale. A report should get you talking not only about content but also about what happens after the message arrives.
Does a small business need a detailed report?
It needs a clear one, not a detailed one. A single page with the message count, the best content and the decisions for next month is enough. Long reports tend to bring more clutter, not more information.
Should I read the ad report separately from the social media report?
Yes, separately but side by side. Ad spend and results should be shown apart so you can tell what your natural work brings and what your paid work brings.
If you would like to go through the report you have, or an account that has never had one, you can write to me through my social media management page. I will listen to your situation and we can work out together what you should be measuring.